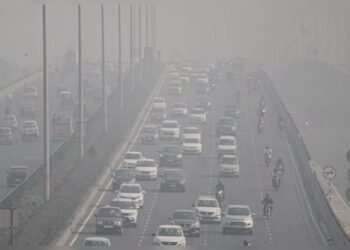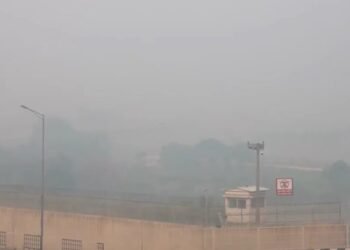


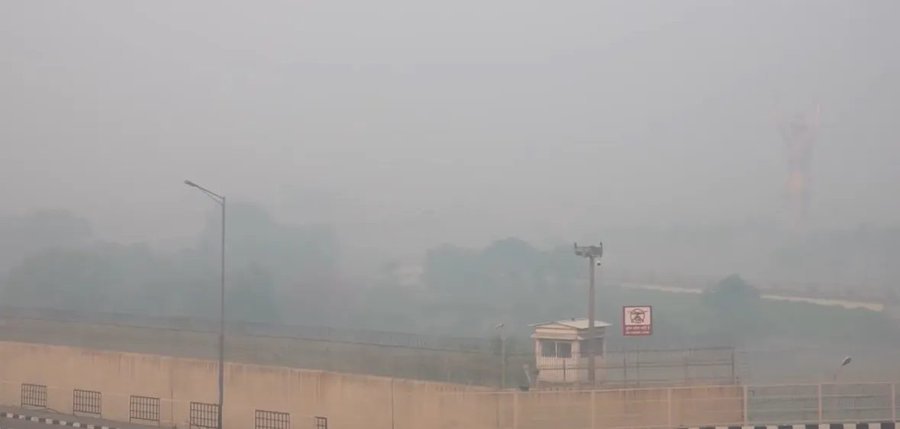
Delhi’s Diwali night Air Quality Index (AQI) showed major gaps, offline stations, and sharp discrepancies with independent readings, sparking manipulation claims..
BY PC Bureau
November 9: On the night of Diwali (November 8, 2026) into the morning of November 9, Delhi’s official air quality monitoring network experienced widespread data blackouts and incomplete reporting precisely as pollution from firecrackers spiked.
Reports highlighted key gaps that raised question mark overs official data: no consistent hourly readings across dozens of stations, a large-scale data blackout overnight, only a small fraction of the roughly 59 stations reporting proper continuous data, stations that were fully functional around 8 pm, and data stopping after pollution levels approached or hit around 1,000 (particularly for PM2.5).
बन गया, बन गया, बन गया भारत विश्व गुरु बन गया।
भारत में हर साल 20 लाख लोग प्रदूषण से मरते हैं इतनी तो कई देशों की आबादी भी नही।
मोदी ने 24 घंटे में 36 घंटे मेहनत करके भारत को दुनिया का “नंबर 1 प्रदूषित देश” बना दिया।
दुनिया के 100 सबसे प्रदूषित शहरों में 99 अकेले भारत के हैं। https://t.co/eRZOFd4Spf— Sanjay Singh AAP (@SanjayAzadSln) November 9, 2026
What the data gaps looked like
Multiple independent reports and analyses of Central Pollution Control Board (CPCB) and Delhi Pollution Control Committee (DPCC) records confirm significant outages. More than half the stations stopped reporting around or after midnight. PM2.5 readings at many locations climbed toward 1,000 µg/m³ and then went blank, while gas monitors at the same stations often continued reporting. Examples include RK Puram (PM2.5 reaching ~924 µg/m³ before data disappeared), and stations such as Nehru Nagar, Mundka, Sonia Vihar, and Dwarka dropping offline for hours.
🚨 SHOCKING: AQI 3,000+ CLAIMED IN DELHI AFTER DIWALI! 🇮🇳
Delhi’s pollution crisis has sparked a major controversy after AAP leader Saurabh Bhardwaj claimed that AQI crossed 3,000 in parts of the capital on Diwali night.
Independent platforms recorded extreme pollution spikes, with https://t.co/sC903MXtYb reporting a peak of 1,331.
However, CPCB’s official city average was 376. The 3,000+ claim remains independently unverified.
Delhi is choking under a toxic blanket of smog. 🌫️
#DelhiPollution #DelhiAQI #India
— Unfiltered RT (@SirCryptoRT) November 9, 2026
Congress leader Ajay Maken noted that 25 of 39 comparable stations recorded no PM2.5 data between 2–3 am; the nine stations that did report averaged around 576 µg/m³ (roughly 38 times the WHO 24-hour guideline). Public display screens at some locations were switched off or unavailable during peak hours, and the next day some public boards showed markedly lower figures than the CPCB dashboard for the same area (e.g., a reported ~200-point gap at one Lodhi Road-linked display.
Official city-wide averages still placed Diwali-day AQI around 376 (“very poor”), with many individual stations in the “severe” category (>400) both on the night and the following morning (e.g., Burari Crossing, Vivek Vihar, DTU, Jahangirpuri, Rohini frequently above 430). Morning averages the next day hovered near 368–371. These are 24-hour or aggregated figures; real-time or hourly peaks were far higher where data existed.
READ: Lung Damage to Heart Risks: The Dangers of Delhi Toxic Air
Independent platforms and political accusations
Independent or community platforms (such as AQI.in) reported much higher real-time city or location peaks—around 1,331 at one point, with some local community sensors cited by AAP leaders showing figures above 3,000. AAP’s Saurabh Bhardwaj accused the BJP-led Delhi government of “AQI data fraud,” claiming stations were shut down, new monitors placed in greener peripheral areas to dilute city averages, and water sprayed near stations in polluted spots. Congress voices similarly questioned whether monitors were deliberately switched off or simply overwhelmed.
These higher independent numbers often reflect different methodologies: real-time/hourly peaks versus official 24-hour averages used for the National Air Quality Index, different station networks, or less rigorous calibration. Official AQI calculation for particulate matter relies on 24-hour averages, which smooth out short, extreme spikes from firecrackers. Technical limits on some monitors (apparent ceiling near 1,000 µg/m³ for PM2.5 at certain stations), power or communication issues, or system overload during extreme events are plausible non-malicious explanations for the blackouts. Similar data gaps have been reported in previous Diwali periods.
Context and limitations
Firecracker use continued despite restrictions, combining with winter meteorology and other sources (including regional stubble burning) to drive the spike. Public information systems (screens and live dashboards) failed to keep up at the worst hours, reducing transparency when residents most needed accurate local readings. New peripheral stations have been noted in analyses as potentially lowering the overall city average compared with older urban stations.
No conclusive public evidence has established deliberate, coordinated falsification of the underlying sensor data by authorities. The pattern of outages concentrated at peak pollution hours, the selective nature of blanks (particulates more than gases in some cases), offline public displays, and large gaps versus independent real-time sensors do, however, undermine confidence in the completeness of the official record for that night. Full raw high-frequency data release, independent audits of station performance and calibration during extremes, and clearer real-time public reporting would help resolve the questions.
Delhi’s air was dangerously polluted on and after Diwali night by any available measure. The incomplete official dataset means the true peak intensity and spatial pattern remain partially obscured.